Will the numbers behind volume investing change your thoughts on crowdfunding?
Note: This post is old and full of youthful naivete.
- The numbers used in this aren’t entirely representative of historical angel returns since I’ve simplified the AIPP data and deal prices seem to be have skyrocketed since I initially wrote this.
- The most important thing you can have as a venture investor is one company in your fund/portfolio that returns at least 1x the entire fund.
- A better study to look at is one I found after the fact from Kevin Dick at Right Side Capital Management: Simulating Angel Investment
- Volume investing & funds like 500 startups were much more unproven when I first wrote this. Some of the latest proof that 500 is working: 1000 startups, 2014 Year in Review, 2015 Premoney Slide Deck.
Also, most of the tables below should have been embedded spreadsheets instead of markdown tables. Apologies.
One of the key axioms of angel investing is that you need to be diversified in a portfolio of companies because 1-2 companies will carry your portfolio’s returns given the high failure rate of between 75 to 90 percent of startups.
I set out to answer the question of:
How many investments should an angel/seed investor make to be adequately diversified?
The easy answer is to say as many as possible. However, diversification is tough. It’s tough to find good companies to fund, and thus it’s tougher to fund 50 companies than it is to fund 5 or fund 500 instead of 50.
My Assumptions
I started with looking at the historical angel investing returns from the Kauffman Foundation’s Angel Investor Performance Project (AIPP). I slightly modified the data for the sake of simplicity. Here are my expected probabilities for outcomes of an angel investment.
| Return | Probability | Notes |
|---|---|---|
| 0x | 70% | Lose Entire Investment |
| 1x | 0% | Get Investment Back |
| 5x | 10% | |
| 10x | 10% | |
| 20x | 10% |
So for every ten investments, seven will go bust and you will lose all your money, one will return 5x, one will return 10x and one will return 20x.
What does a 20x return look like?
Here are two sample 20x return scenarios.
- You invest part of a $1mm seed round @ a $3mm pre-money valuation ($4mm post) and the company raises no further money and exits for $80mm.
- You invest part of a $1mm seed round @ a $3mm pre-money valuation ($4mm post). The company raises a $3mm Series A at a $8mm pre-money valuation ($11mm post) and exits for $110mm.
Download the spreadsheet with the two cap table scenarios from above.
The Expected Return
The expected return is calculated by multiplying the scenarios listed above:
(0 * .7) + (1 * .0) + (5 * .1) + (10 * .1) + (20 * .1) = 3.5
If there was no variation and the probabilities held exactly true, you would expect to return 3.5x your money (i.e. if I invest $100K, I would expect to get $350K back). However, regardless the probabilities, the outcomes are never 100% certain - for example, if I flip a coin, will I get 50 heads and 50 tails even though the probability is 50% heads, 50% tails)?
In the table below, we can see how time to recover our investment affects IRR - let’s use 20% IRR as the hurdle for “venture style” returns, so we’re looking at a 7 year window to exit.
| Year 0 | Year 1 | Year 2 | Year 3 | Year 4 | Year 5 | Year 6 | Year 7 | IRR |
|---|---|---|---|---|---|---|---|---|
| -100K | 0 | 0 | 0 | 0 | 0 | 0 | 350K | 19.6% |
| -100K | 0 | 0 | 0 | 0 | 0 | 350K | 23.22% | |
| -100K | 0 | 0 | 0 | 0 | 350K | 28.47% | ||
| -100k | 0 | 0 | 0 | 350K | 35.78% | |||
| -100k | 0 | 0 | 350K | 51.83% |
tldr: The earlier a company exits, the higher the IRR.
A couple more assumptions I’ll use for this test
- There is no pro rata follow on investment.
- The same check size is written every time.
Before moving forward, the test and its results/implications are all predicated on these assumptions about the probability of outcomes of angel investments holding true (which is a gross oversimplification).
The Test
Based on the probabilities of angel investment outcomes above, I ran a simulation of what the expected returns of a portfolio size of 5, 10, 20, 50, 75, 100, 150, 200, and 500 would look like. I set out to run the simulation 10,000 times for each portfolio size, but Excel kept crashing so I shrunk each simulation down to only being run 1,000 times per portfolio size.
You can download the raw Excel data here (which includes further explanations of how to run this same test yourself or tweak it to your specifications).
The Results
Here are the results in table form. The first row is the number of investments.
| # of Investments | 5 | 10 | 20 | 50 | 75 | 100 | 150 | 200 | 500 |
|---|---|---|---|---|---|---|---|---|---|
| Mean Return | 3.59 | 3.55 | 3.54 | 3.52 | 3.51 | 3.49 | 3.49 | 3.49 | 3.51 |
| Median Return | 3.00 | 3.50 | 3.50 | 3.5 | 3.53 | 3.50 | 3.47 | 3.48 | 3.49 |
| Min Return | 0 | 0 | 0 | 1.30 | 1.4 | 1.60 | 1.8 | 2.15 | 2.63 |
| Max Return | 14 | 11 | 9.25 | 6.50 | 5.60 | 5.70 | 5.27 | 5.08 | 4.39 |
| % 0x | 16.9% | 2.6% | 0.1% | 0% | 0% | 0% | 0% | 0% | 0% |
| % >1x | 83.1% | 92.9% | 98.7% | 100% | 100% | 100% | 100% | 100% | 100% |
| % >2x | 70.5% | 80.2% | 87.8% | 96.9% | 98.5% | 99.4% | 99.7% | 100% | 100% |
| % >3x | 56.9% | 61.9% | 66.9% | 72.7% | 75.7% | 79.1% | 83% | 86.5% | 96.2% |
Some notes to explain the table
- Mean Return: the quotient of the sum of the returns divided by 1,000.
- Median Return: the middle of the range of 1,000 simulated outcomes
- Min Return: The lowest outcome/return in the 1,000 scenarios of the portfolio size.
- Max Return: The highest outcome/return in the 1,000 scenarios of the portfolio size.
- 0x: Percentage of the time the investor loses all his/her money
- > 1x: Percentage of the time the portfolio returns at least 1x
- > 2x: Percentage of the time the portfolio returns at least 2x
- > 3x: Percentage of the time the portfolio returns at least 3x
My Take Aways
I set out to answer the question of: “How many investments should an angel/seed investor make to be adequately diversified?”
Assuming our probabilities of outcomes hold true:
- At 20 investments, you have a 98.7% chance of at least getting your money back (> 1x). This is probably the minimum number of deals I would look to have in an angel portfolio.
- At 50 investments, you have a 96.9% chance of at least doubling your money (> 2x).
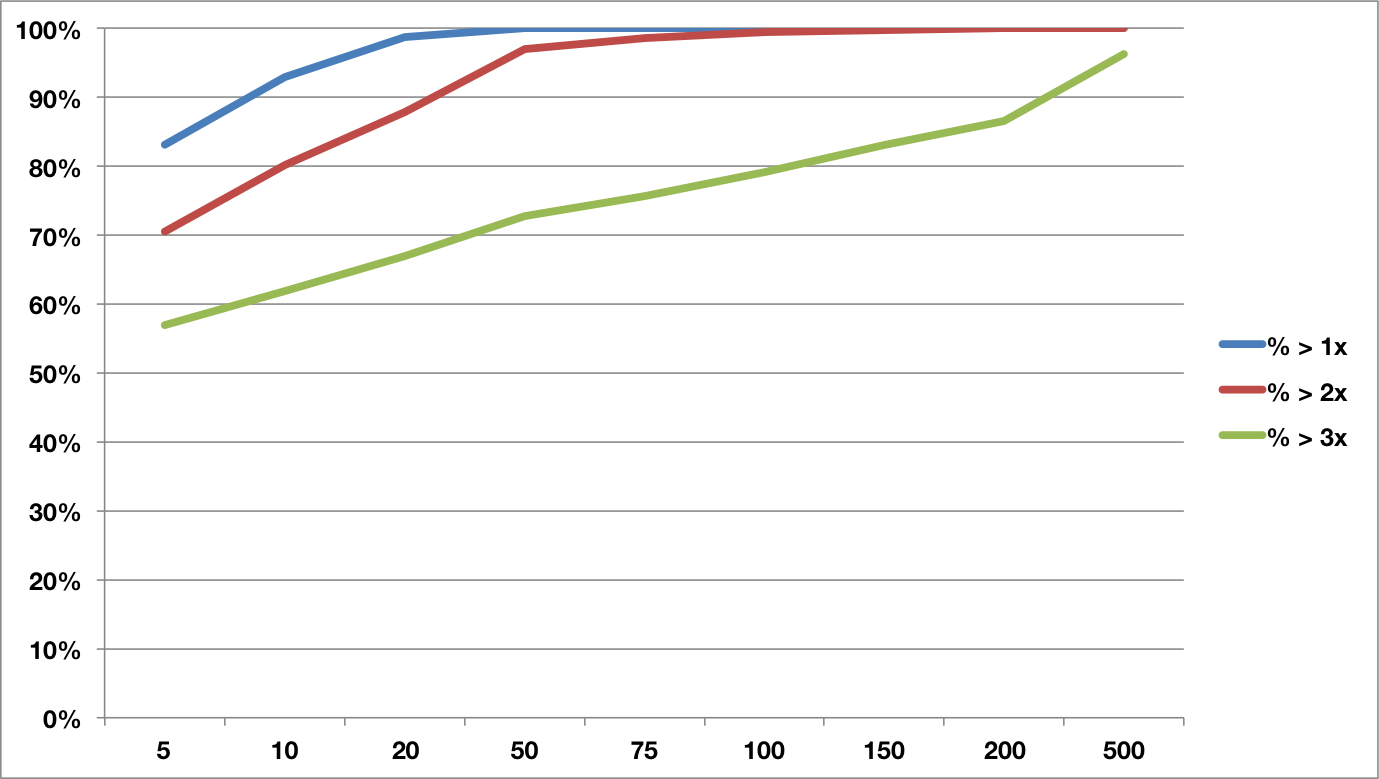
- At 500 investments, you have a 96.2% chance of at least tripling your money (> 3x). As you diversify through volume investing, the closer you get to being assured of your expected value.
| Portfolio Size | 5 | 10 | 20 | 50 | 75 | 100 | 150 | 200 | 500 |
|---|---|---|---|---|---|---|---|---|---|
| >1x | 83.1% | 92.9% | 98.7% | 100% | 100% | 100% | 100% | 100% | 100% |
| >2x | 70.5% | 80.2% | 87.8% | 96.9% | 98.5% | 99.4% | 99.7% | 100% | 100% |
| >3x | 56.9% | 61.9% | 66.9% | 72.7% | 75.7% | 79.1% | 83% | 86.5% | 96.2% |
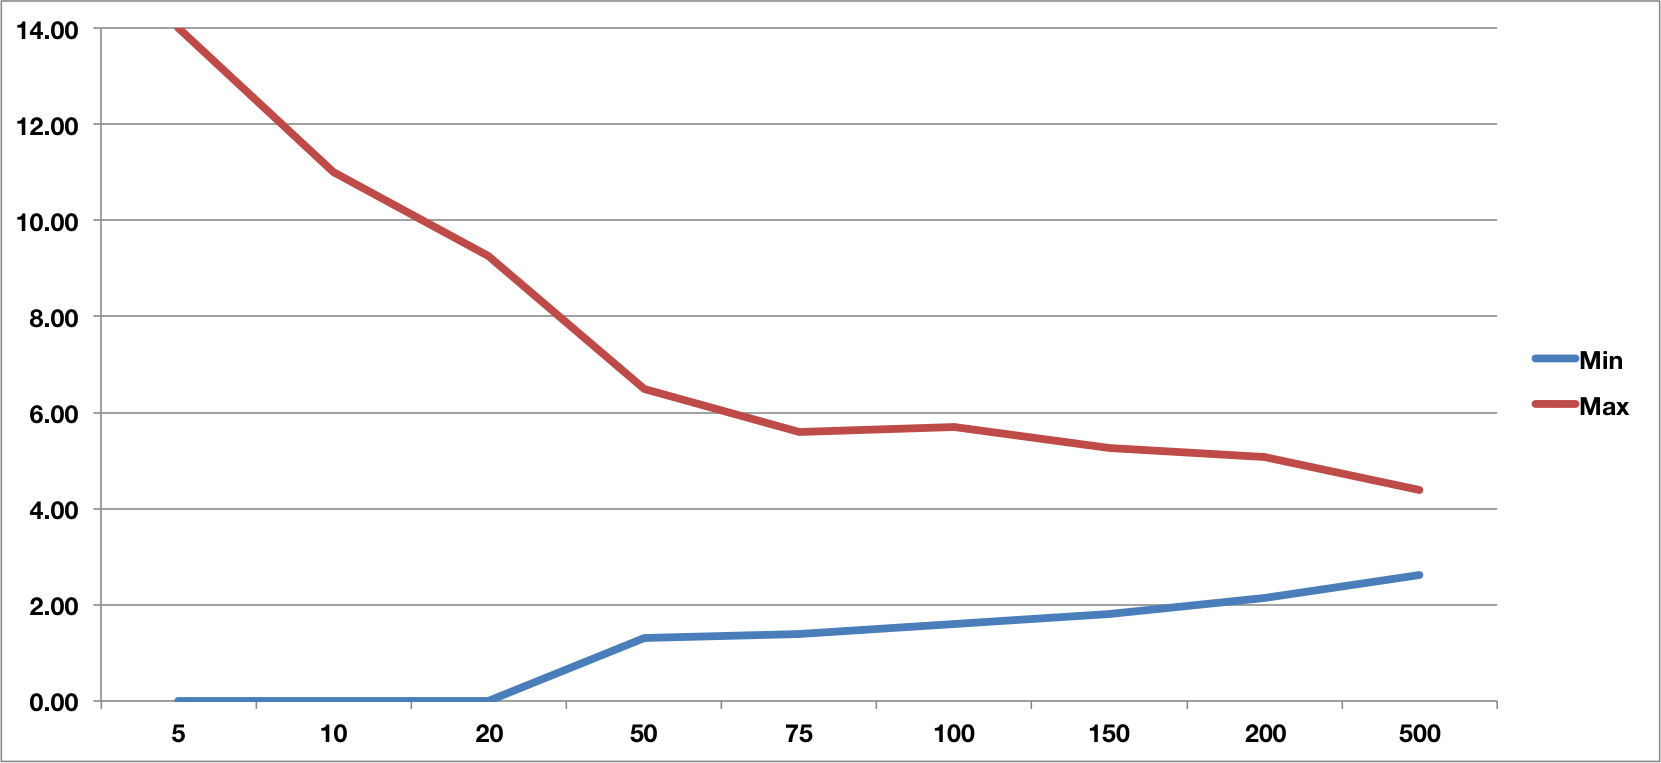
The other interesting take away is that variation in outcomes decreases through volume investing. In the graph below, notice how the maximum and minimum portfolio outcomes converge to the expected return of 3.5x as the portfolio size increases. Through volume investing, an investor can almost lock in a certain return and know what they are going to get.
While volume investing may decrease risk, it also decreases potential reward (one of the main axioms of investing) and chance to generate returns above the expected 3.5x.
| Portfolio Size | 5 | 10 | 20 | 50 | 75 | 100 | 150 | 200 | 500 |
|---|---|---|---|---|---|---|---|---|---|
| Min Return | 0 | 0 | 0 | 1.30 | 1.4 | 1.60 | 1.8 | 2.15 | 2.63 |
| Max Return | 14 | 11 | 9.25 | 6.50 | 5.60 | 5.70 | 5.27 | 5.08 | 4.39 |
The Possible Implications
Dave McClure’s 500 Startups is the only fund I know of that invests at this kind of volume > 500 deals (although his check size varies and 70% of his money is ear marked for follow on). However, “spray and pray” funds (popularized by Ron Conway) seem like a more stable investment thesis than they are made out in the press. The sheer volume of investments (and large class sizes) done by Y Combinator start to make more sense as well.
However, we don’t all have millions of dollars to angel invest, but how can we put this data to use for us? Between AngelList, Funders Club, and WeFunder, you can start volume investing with as little as $1,000 (Angel List) to $2,500 (Funders Club) with those sites screening and doing the due diligence since clearly it isn’t feasible to source 500 good deals yourself individually.
Hypothetically, with $500k, you could conceivably do 500 investments at AngelList and have a really high chance of > 3x’ing your money. Even a smaller portfolio of 50 deals (investing ~$50K) has a 96.9% chance of at least doubling your money.
Future Studies to Consider
- This example doesn’t include black swan outliers (like how Airbnb and DropBox made up the majority of Y Combinator’s returns at the time I first wrote this)
- This example doesn’t include any kind of management fees as part of a fund structure.
- The data can be expanded to better reflect future rounds of funding.
Disclaimer: I am not a financial advisor. You should not rely on anything stated in this blog post as legal, financial, accounting, investment, tax, or any other kind of regulated advice.
The AIPP data is publicly available for download here.